A research debrief can contain accurate findings and still fail to communicate key themes of the debrief. This is usually due to the considerable amount of manual work it takes to turn hours of recordings, transcripts and observations into a consumable, impactful and client-friendly format.
Consider a study involving 12 online focus groups. The research team has recordings, transcripts, moderator notes and several relevant verbatims. Adding video evidence to a presentation means reviewing multiple videos to find relevant bytes, confirming whether each finding reflects the original discussion, and producing it to be included in the presentation. All of which is an additional workflow in itself.
Instead, using a video presentation can make important findings easier to follow, while keeping every interpretation traceable to the participant's actual words.
TL;DR
Start with verified research findings, instead of a presentation script.
Use transcripts and original recordings to check participant quotes and context.
Build a clear story around the findings
Use text-to-video tools to curate supporting visuals
Combine selected participant clips with slides and insert visuals (where they add value).
Call out AI-generated visuals (if used), separately from genuine research evidence.
Check participant consent, permissions and confidentiality before sharing recordings.
Why research findings can get challenging to present
Research teams usually face three problems when preparing a debrief:
Large volumes of raw data to review: Manually reviewing recordings and transcripts across multiple sessions takes time, particularly when the same topic appears in different conversations.
Disconnected evidence: Notes, spreadsheets and video files often sit in different locations. Researchers have to switch between them to verify a single observation.
Lack of visual communication: A presentation containing text-heavy slides text does not always help stakeholders understand how participants expressed a particular concern.
One solution utilized extensively by experienced researchers is to identify which insights need a visual or spoken example, and build the presentation around those moments.
What makes a research video presentation useful?
A polished video is not necessarily a good research deliverable. The quality of the evidence still matters.
Look for these characteristics:
Relevant clips: Every clip should demonstrate a specific finding rather than simply make the presentation more entertaining.
Accurate context: Include enough of the question and response to preserve what the participant meant.
Clear attribution: Identify the session or participant using approved research identifiers.
Balanced findings: Include disagreement and exceptions where they affect the interpretation.
Readable supporting material: Keep captions, charts and supporting text easy to follow.
There is also a practical governance issue. Confirm participant consent, usage permissions and confidentiality requirements before distributing recordings beyond the research team.
Transcription quality needs attention too. A misheard word can change the meaning of a participant's response. Researchers should understand how to assess AI transcription accuracy before using transcript excerpts as evidence in a presentation.
A practical workflow for creating research video presentations
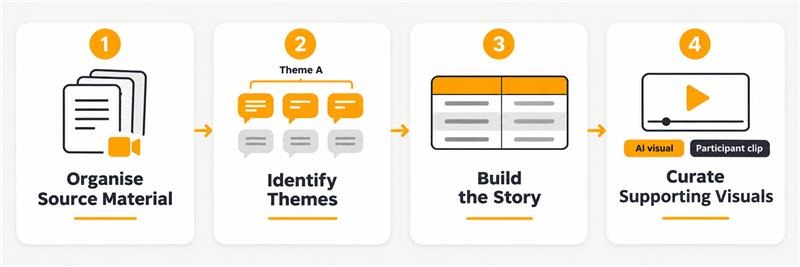
Here’s a repeatable process reduces the toggle-click-repeat cycle that slows down reporting:
1. Start with verified research findings
Organize source material by research session - this could include group recordings, transcripts, discussion guides and moderator notes.
Next, identify recurring themes, disagreements and unexpected responses - the way you usually would. As always, avoid selecting quotes simply because they sound persuasive. For example, let’s say 8 out of 12 groups mention difficulties with understanding a product-onboarding process. However, only 3 specifically identify instructions as the problem, while the remaining groups struggle with navigation. These must be presented as related observations, rather than collapsed into a single broad bucket eg. ‘Poor usability’.
2. Use transcripts to locate the original discussion
Researchers working with multiple sessions could benefit from this guide to analyzing focus group transcripts; to organise responses, establish themes and select supporting quotes. This approach is proven to reduce manual effort of searching through recordings every time a quote needs to be checked.
flowres.io allows researchers to navigate video recordings by clicking corresponding lines in interactive transcripts. Its analysis and Q&A functions also link findings back to source quotes and video moments, making it easier to verify an interpretation before using it in a client presentation.
3. Build a clear story around the findings
A video presentation should address research questions, rather than simplistically follow the discussion guide. Arrange findings according to the decisions stakeholders need to make. Keep supporting evidence beside each claim. Here’s a practical structure, anchored around four elements:
For example, a study exploring a new banking application might identify that participants understand the advertised benefits but struggle to locate the Account Opening option.
In this case, instead of simply showing ten quotes, the presentation can introduce the usability issue, include two contrasting participant clips and explain what the team should investigate next. This way, contradictory responses that matter are retained.
4. Use text-to-video tools to curate supporting visuals
Text-to-video creation tools help lucidly demonstrate a process overview OR create visual transitions that make a layered finding easier to understand. You could also combine original participant clips with slides and add explanatory AI-generated visuals. However, remember to call out every participant quotation through speaker attribution and timestamp.
For example, a researcher preparing a presentation about customer onboarding could create a visual sequence showing the stages of the user journey. Tools offering text-to-video generation can help turn written prompts into video content. Such AI-generated visuals are supporting material, not participant evidence. Where used, it is necessary to call it out as such. Similarly, clearly tag original interview recordings, verified quotes.
flowres.io supports this workflow through one-click bookmarks, interactive transcripts and snippet reels that allow researchers to organise captured moments for client presentations. Teams looking to reduce deck-making time can also read about ways to save time analyzing a qualitative research study, particularly the value of bookmarking and preparing analysis structures before the reporting stage.
The bottom line for research teams
Contrary to popular belief, the value of using video tools in curating research debriefs is not that it makes research look ‘more polished’. Instead, the value lies in it giving stakeholders a direct view of the conversations behind the findings. Turning qualitative research findings into video presentations can communicate findings more effectively and bring them to life for stakeholders. Researchers should not have to spend hours locating the same quote, checking a timestamp or rebuilding a clip in another application. Instead, a research workflow that connects transcripts, source video and analysis makes these tasks easier to manage.
Frequently asked questions
1. What is a research findings video presentation?
It is a visual presentation of qualitative research findings that combines key insights, participant quotes, selected recordings and supporting explanations.
2. Can AI create videos from research findings?
Yes. Text-based AI video tools can create explanatory visuals from approved scripts/ prompts. However, AI-generated content should never be presented as genuine participant evidence.
3. How do you choose clips for a research presentation?
Select moments that directly support OR clearly point to a finding, while preserving the participant's context and representing the discussion accurately.
4. How can researchers keep video findings traceable?
Link every selected clip to its original recording, transcript passage, timestamp and research session.
5. What is the role of transcripts in research videos?
Transcripts help researchers search conversations, identify relevant passages and verify the exact wording before selecting video clips.
Enjoy reading flowres.io?

Ayushi Jain
(Content Writer)
She is a content writer specializing in the intersection of human inquiry and modern efficiency. Through her work at flowres.io, she explores how qualitative research is evolving and highlights the tools that help researchers maintain their creative flow.
Posted on: Nov 16, 2026

